How to Benchmark in Linux
Proper Linux benchmarking is not about the biggest single run. It is about building a clean baseline, controlling variables, repeating runs for statistical validity, and generating charts that show the data clearly.
The Phoronix Test Suite provides the structure: repeatable workloads, saved results, baseline comparison, and batch automation. MangoHud captures frame-time data. Together with a Python plotting tool, you get a complete workflow from raw test data to publication-ready charts.
Core Principle: Test One Variable at a Time
Before running any benchmarks:
- Same hardware, distro, and driver stack each time
- Same game patch or application version
- Same graphics preset and resolution
- Baseline run first, then one controlled change, then re-run
- Repeat at least 3 to 5 times per configuration
- Log hardware info (CPU, GPU, kernel, Mesa version) before each session
Phoronix Test Suite saves this metadata automatically. If you change multiple variables at once, your data proves nothing.
Install the Tools
Phoronix Test Suite
# Debian/Ubuntu
sudo apt install phoronix-test-suite

# Fedora
sudo dnf install phoronix-test-suite

# Arch
sudo pacman -S phoronix-test-suite
MangoHud (required for 1% lows and frame consistency)
MangoHud captures frame-time data needed to calculate 1% lows and analyze frame pacing. Without it, you only get average FPS.
# Debian/Ubuntu
sudo apt install mangohud

# Fedora
sudo dnf install mangohud

# Arch
sudo pacman -S mangohud
Plot.py for Charts
Clone the Linux benchmarks repository to get the plotting script:
git clone https://github.com/ChrisTitusTech/linux-benchmarks.git
cd linux-benchmarks
Install Python dependencies:
pip install numpy pandas matplotlib
Prep Your System
Before every test session:
- Reboot and let the system settle
- Close browsers, Discord, RGB software, and unnecessary services
- Plug in laptops and use the same power mode for every run
- Keep the same CPU governor and GPU mode
- Check kernel, Mesa version, and game patch level
- Note the date/time and save this metadata somewhere
Phoronix automatically logs hardware info, so you just need to know what you changed between runs.
Quick Workflow: Batch Setup and Benchmark
1. Configure Batch Mode Once
phoronix-test-suite batch-setup
This prompts you to set defaults for automated testing: whether to save results to OpenBenchmarking, how many times to run each test, and whether to use strict mode. Set these once and reuse them for consistency.
2. Run Batch Benchmarks
export MANGOHUD=1
export MANGOHUD_CONFIG="output_folder=$HOME/benchmark-logs,autostart_log=1,benchmark_percentiles=AVG+1+0.1"

TEST_RESULTS_NAME="baseline" \
TEST_RESULTS_IDENTIFIER="stock-system" \
TEST_RESULTS_DESCRIPTION="Baseline on stock kernel" \
TEST_EXEC_PREPEND="mangohud" \
phoronix-test-suite batch-benchmark pts/c-ray pts/compress-7zip pts/openssl
The batch mode processes all tests without prompting you. Logs are saved to ~/.phoronix-test-suite/ with metadata automatically included.
Repeat this command after making one change (kernel, driver, Proton version) with a different identifier:
export MANGOHUD=1
export MANGOHUD_CONFIG="output_folder=$HOME/benchmark-logs,autostart_log=1,benchmark_percentiles=AVG+1+0.1"

TEST_RESULTS_NAME="tested" \
TEST_RESULTS_IDENTIFIER="zen-kernel" \
TEST_RESULTS_DESCRIPTION="Same workload on Zen kernel" \
TEST_EXEC_PREPEND="mangohud" \
phoronix-test-suite batch-benchmark pts/c-ray pts/compress-7zip pts/openssl
Now you have two saved result sets to compare.
3. Export Results to CSV
After running benchmarks, export the results to ~/benchmark-logs:
phoronix-test-suite result-file-to-csv baseline ~/benchmark-logs/baseline.csv
phoronix-test-suite result-file-to-csv tested ~/benchmark-logs/tested.csv
This creates CSV files that plot.py can read. The CSV contains:
- Benchmark name
- Average score (or FPS)
- Run count
- Variance, standard deviation, and standard error (if available)
- System metadata (CPU, GPU, kernel)
MangoHud logs are already being saved to ~/benchmark-logs as individual CSV files with frame-time data.
4. Understanding the Export-CSV Workflow
The export process transforms Phoronix binary result files into text formats:
- result-file-to-csv: Standard export with aggregated stats per benchmark
- result-file-raw-to-csv: Individual run data; useful if you need to inspect variance
- result-file-stats: Statistical summary
For plot.py, you need CSV files with:
- Phoronix CSV exports — Benchmark names, average FPS/scores, run count, variance
- MangoHud CSV logs — Frame-time data with columns like
fpsandframetime
Both get saved in the same directory and plot.py finds them automatically.
Running plot.py to Generate Charts
Once you have CSV files from both Phoronix exports and MangoHud logs in ~/benchmark-logs, generate visualizations:
cd /path/to/linux-benchmarks
python plot.py --log-dir ~/benchmark-logs
The script generates two types of charts:
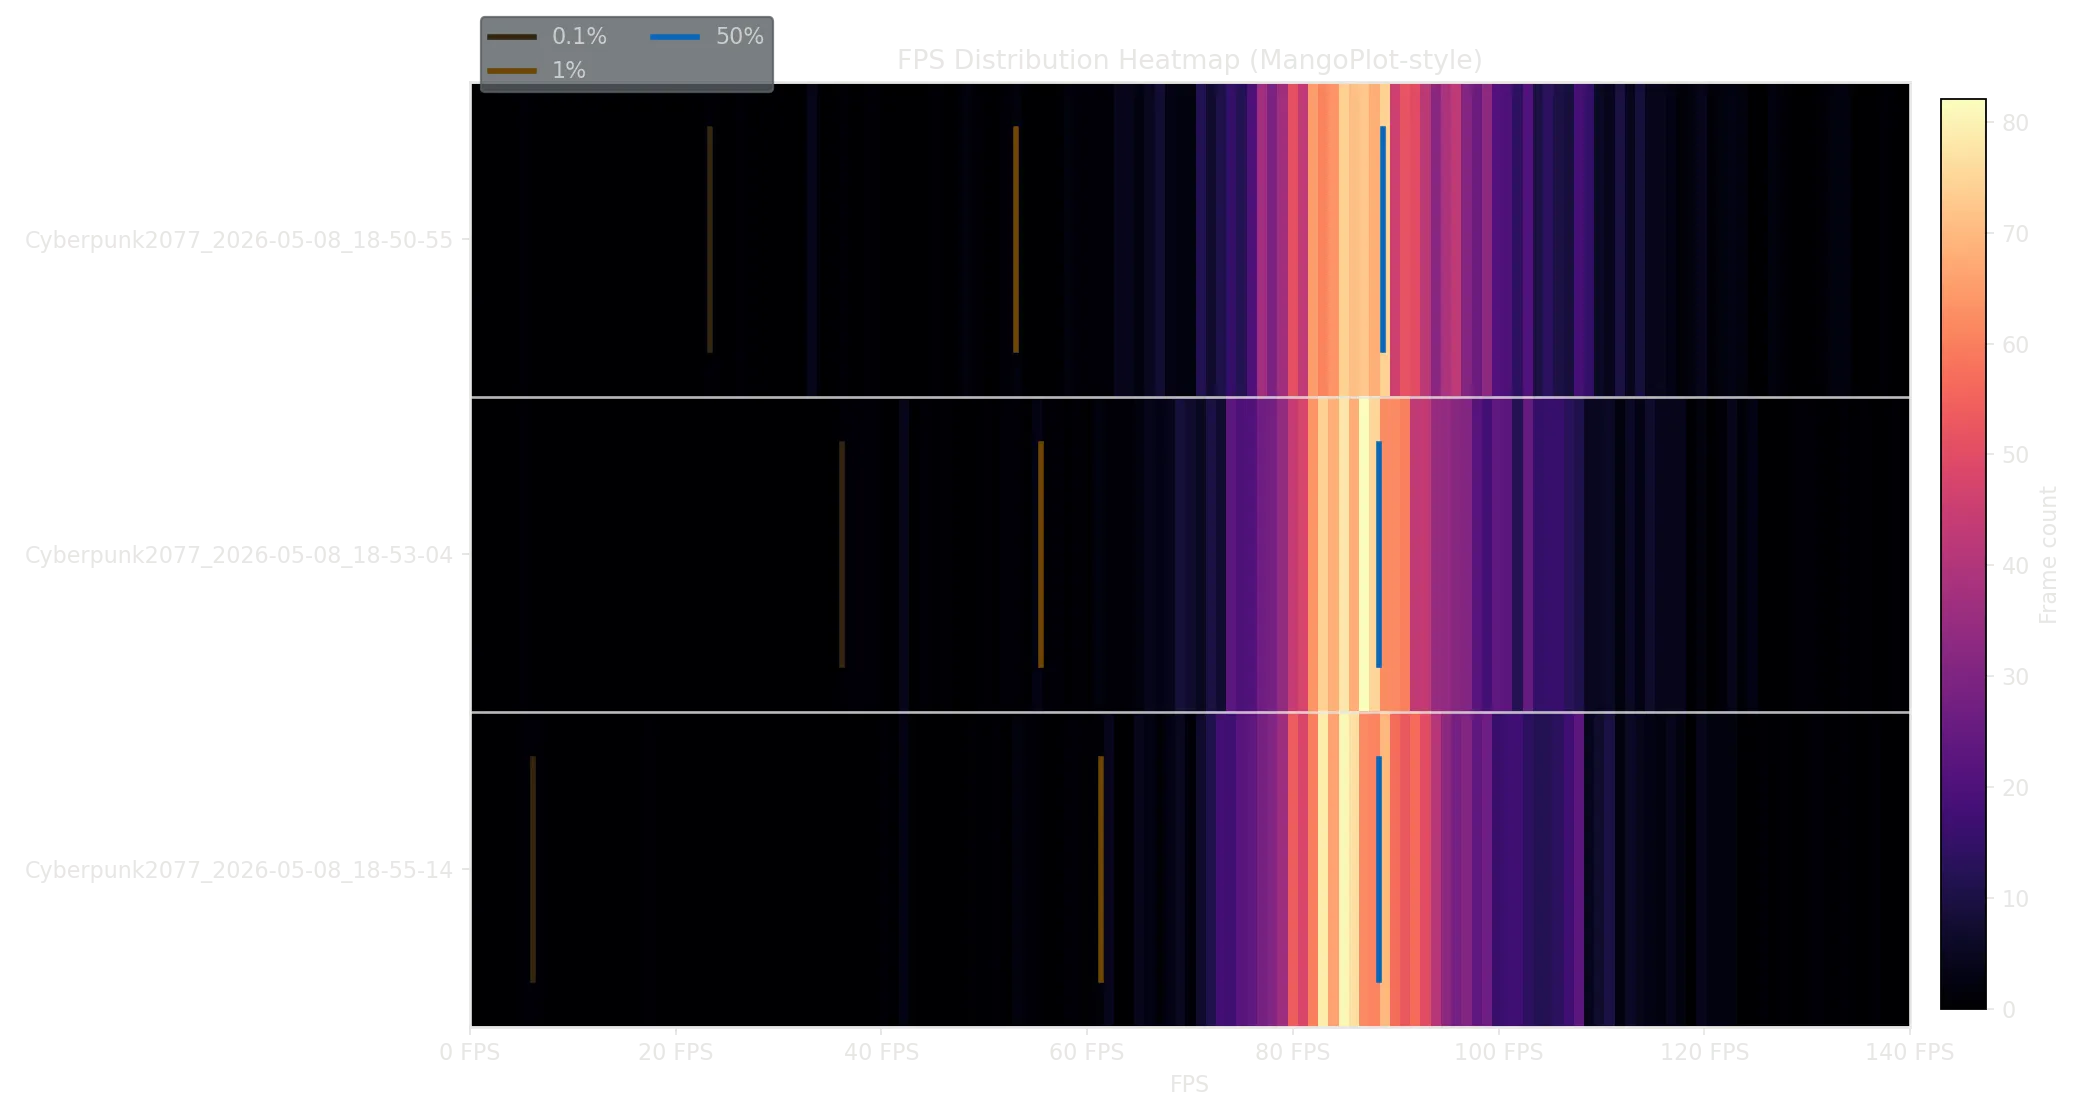
1. MangoHud FPS Distribution Heatmap
Shows frame-time consistency across all runs. Each row is one run, and the heatmap colors show how many frames hit each FPS bucket. Vertical lines mark:
- 0.1%ile (darkest): lowest 0.1% of frames
- 1%ile (dark): lowest 1% of frames
- 50%ile (blue): median frame rate
If the heatmap is wide and flat, frames are inconsistent. If it is tall and narrow, frame pacing is smooth.
2. Phoronix Average FPS Bar Chart
Shows average performance per benchmark with run count, variance, and standard error labeled. If variance is high or run count is low, that test may not be stable yet.
Output Files
Both charts are saved as PNG files in ~/benchmark-logs:
mangohud_bar_chart.png— FPS distribution heatmap (frame consistency from MangoHud logs)*_avg_fps_bar_chart.png— One per Phoronix CSV export (average FPS per benchmark)
Enriching Phoronix Data with MangoHud Stats
If your Phoronix export only has one aggregate result per benchmark (common when exporting from the GUI), plot.py automatically matches MangoHud runs by name pattern and enriches the Phoronix data with:
- Actual run count from multiple MangoHud passes
- Calculated variance and standard error
- Frame-time percentiles (0.1%, 1%, 50%)
Complete Example: Kernel Comparison
Here’s a real-world walkthrough:
# 1. Configure batch mode
phoronix-test-suite batch-setup

# 2. Set up logging environment
export MANGOHUD=1
export MANGOHUD_CONFIG="output_folder=$HOME/benchmark-logs,autostart_log=1,benchmark_percentiles=AVG+1+0.1"

# 3. Run baseline on stock kernel (reboot first)
TEST_RESULTS_NAME="kernel-compare" \
TEST_RESULTS_IDENTIFIER="stock-distro" \
TEST_RESULTS_DESCRIPTION="Stock distro kernel" \
TEST_EXEC_PREPEND="mangohud" \
phoronix-test-suite batch-benchmark pts/c-ray pts/compress-7zip pts/openssl

# 4. Reboot into Zen kernel and run same tests
TEST_RESULTS_NAME="kernel-compare" \
TEST_RESULTS_IDENTIFIER="zen-kernel" \
TEST_RESULTS_DESCRIPTION="CachyOS Zen kernel" \
TEST_EXEC_PREPEND="mangohud" \
phoronix-test-suite batch-benchmark pts/c-ray pts/compress-7zip pts/openssl

# 5. Export both results to CSV
phoronix-test-suite result-file-to-csv kernel-compare ~/benchmark-logs/kernel-compare.csv

# 6. Run plot.py to generate charts
cd /path/to/linux-benchmarks
python plot.py --log-dir ~/benchmark-logs
Now you have:
- One bar chart showing average FPS for each test under both kernels
- Run counts, variance, and error bars on the chart
- MangoHud frame-time heatmaps if you also logged with MangoHud
This is publication-ready data: controlled variables, multiple runs, statistical validity, and clear visualization.
What the Charts Tell You
Bar chart reading:
- Higher bars = better performance
- Variance labeled in red: if it is high, the result is noisy
- Small error bars = consistent performance across runs
- Large error bars = inconsistent or thermal-throttled performance
Heatmap reading:
- Tall narrow heatmap = consistent frame pacing
- Wide scattered heatmap = erratic frame delivery, even if average FPS is high
- Compare rows: if one kernel produces more consistent colors, it has better frame consistency
Workflow Checklist
- Reboot and verify kernel/driver/Mesa version
- Close unnecessary services
- Run
phoronix-test-suite batch-setuponce - Run baseline:
phoronix-test-suite batch-benchmark pts/... - Make one change only (kernel, driver, etc.)
- Run same tests again with new identifier
- Export:
phoronix-test-suite result-file-to-csv <name> - Generate charts:
python plot.py --log-dir <path> - Compare against baseline
- Repeat for next variable
The Final Results